
You are here: Home > visualising information
April 14, 2010
visualising information
Posted by dogpossum on April 14, 2010 11:51 AM in the category design and learning and research | Comments (0)
We've only spent a tiny bit of time on this in class, but I'm interested in visualising information. Being a word person, I've always tended to represent information in words. But working on the MLX websites and programs I've also had to figure out ways of representing information in other ways. Dancers during an exchange aren't interested in lots of words (and are often too tired to figure them out), and, frankly, who wants to read a whole bunch of long, boring sentences when there's exciting action things to be done?
There are a range of accessibility issues at play here as well, and reading problems are quite common in dancers.
So here're a few sites I've found that tackle this issue of 'visualising information'
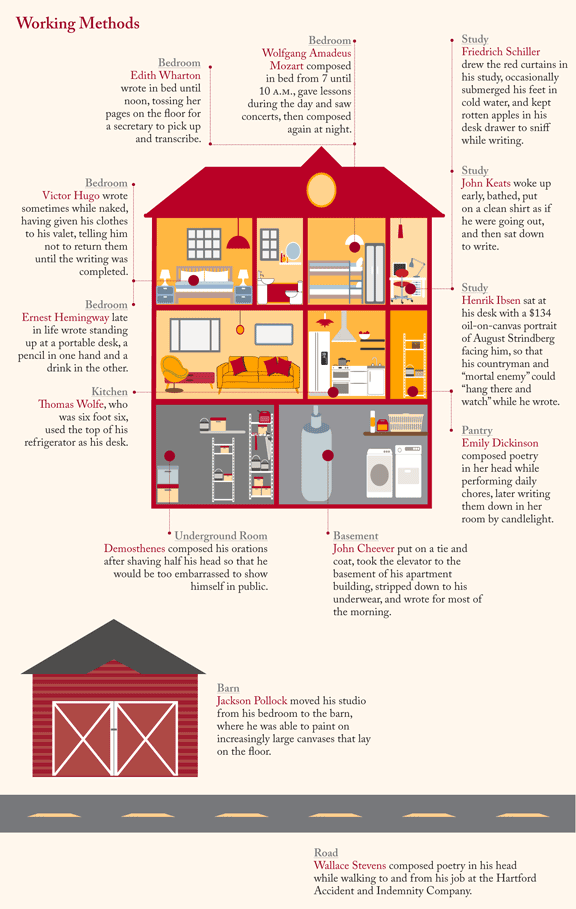
This one is taken from Lapham's Quarterly, which is a really nice online magazine/journal dealing with history, literature, art - all that high brow action. But the tone is cheery and a little wiggedy, and they tweet some really cool stuff.
This American Infographic features "infographical companions to the celebrated radio show". In other words, it is a series of images created in response to episodes of the This American Life radio show.
There is, of course Edwarde Tufte, king of visualising information. Tufte had a walk-on part in my last essay. With a line, I think.
Newsflow visualises news stories in real time, as they are published. This one is FULLY SICK.
Infosthetics is a blog capturing links to really interesting 'info visualisation' items.
textarc 'visualises' the words of books or text. This is magic.
We Feel Fine, visualising 'I feel' or 'feeling' text from blogs.
Visual Complexity is... well, lots of visual information stuff.
Edit: Something critiquing the 'vizualisation cargo cult'.
Someone else getting cranky about dodgy info visualisation.
A tool for doing your own fancy visualisations.
Another Edit: Visual information and The Times through history.
Posted by dogpossum on April 14, 2010 11:51 AM in the category design and learning and research

About dogpossum
i live in
contact
dogpossum at this domainelsewhere
http://twitter.com/dogpossumhttp://8tracks.com/dogpossum
MLX5
MLX6
MLX7
MLX8
MJDA
Salty Mama


Powered by Movable Type 4.32-en | Syndicate this site (XML) |  This weblog is licensed under a Creative Commons License
This weblog is licensed under a Creative Commons License
Comments
Post a comment